 When it is out of the question to delay delivery, the solution is a prioritization strategy in order to do the best possible job within the time constraints.
The scenario is as follows: You are the test manager. You made a plan and a budget for testing. Your plans were, as far as you know, reasonable and well founded. When the time to execute the tests approaches, the product is not ready, some of your testers are not available, or the budget is just cut. You can argue against these cuts and argue for more time or whatever, but that doesn’t always help. You have to do what you can with a smaller budget and time frame. Resigning is not an option. You have to test the product as well as possible, and you have to make sure it works reasonably well after release. How to survive?
There are several approaches, using different techniques and attacking different aspects of the testing process. All of them aim at finding as many defects as possible, and as many serious defects as possible, before product release.
In this article we are talking about the higher levels of testing: integration, system and acceptance test. We assume that developers have done some basic level of testing of every program (unit testing). We also assume the programs and their designs have been reviewed in some way. Still, most of the ideas presented are applicable if nothing has been done before you take over as the test manager. It is, however, easier if you know some facts from earlier quality control activities such as design and code reviews and unit testing.
The bad game
You are in a bad game with a high probability of loosing: You will loose the game any way, by bad testing, or by requiring more time to test. After doing bad testing you will be the scapegoat for lack of quality. After reasonable testing you will be guilty for late release.
How to get out of the game?
You need some creative solution, namely you have to change the game. You need to inform management about the impossible task you have in such a way that they understand. You need to present alternatives. They need a product going out of the door, but they also need to understand the RISK.
One strategy is to find the right quality level. Not all products need to be free of defects. Not every function needs to work. Sometimes you have options about product quality. This means you can cut down testing in less important areas.
Another strategy is priority: Test should find the most important defects first. Most important means often “in the most important functions”. These functions can be found by analyzing how every function supports the mission, and checking which functions are critical and which are not. You can also test more where you expect more defects. Finding the worst areas in the product soon and testing them more will help you find more defects. If you find too many serious problems, management will often be motivated to postpone the release or give you more time and resources. Most of this article is about a combination of most important and worst areas priority.
A third strategy is making testing faster in general. One major issue here is automation of test execution. But be cautious: Automation can be expensive, especially if you have never done it before or if you do it wrong! However, experienced companies are able to automate test execution with no overhead compared to manual testing.
A fourth strategy is getting someone else to pay. Typically, this someone else is the customer. You release a lousy product and the customer finds the defects for you. Many companies have applied this. For the customer this game is horrible, as he has no alternative. But it remains to be discussed if this is a good strategy for long term success. So this “someone else” should be the developers, not the testers. You may require the product to fulfill certain entry criteria before you test. Entry criteria can include certain reviews having been done, a minimum level of test coverage in unit testing, and a certain level of reliability. The problem is: you need to have high-level support in order to be able to enforce this. Entry criteria tend to be skipped if the project gets under pressure and organizational maturity is low.
The last strategy is prevention, but that only pays off in the next project, when you, as the test manager, are involved from the project start on.
1. Understanding necessary quality levels
Software is embedded in the larger, more complex business world. Quality must be considered in that context.
You have to be sure which qualities and functions are important. Fewer defects do not always mean more profit! You have to research how quality and financial performance interact. Examples of such approaches include the concept of Return on Quality (ROQ) used in corporations such as AT&T. ROQ evaluates prospective quality improvements against their ability to also improve financial performance. Be also aware of approaches like Value Based Management. Avoid to fanatically pursuing quality for its own sake.
Thus, more testing is not always needed to ensure product success!
2. Priority in testing most important and worst parts of the product
Risk is the probability for damage to occur. The way to assess risk is outlined in figure 1 . Risk analysis assesses damage during use, usage frequency, and determines probability of failure by looking at defect introduction.
Testing is always a sample. You can never test everything, and you can always find more to test. Thus you will always need to make decisions about what to test and what not to test, what to do more or less. The general goal is to find the worst defects first, the ones that NEED TO BE FIXED BEFORE RELEASE, and to find as many such defects as possible.
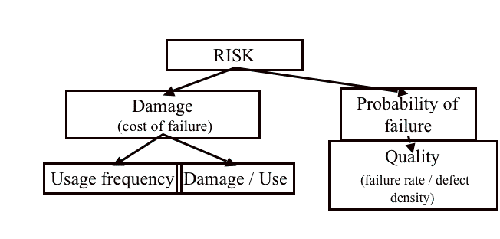
Figure 1: Risk definition and structure
This means the defects must be important. The problem with most systematic test methods, like white box testing, or black box methods like equivalence partitioning, boundary value analysis or cause-effect graphing, is that they generate too many test cases, some of which are less important. A way to lessen the test load is finding the most important functional areas and product properties. Finding as many defects as possible can be improved by testing more in bad areas of the product. This means you need to know where to expect more defects.
When dealing with all the factors we look at, the result will always be a list of functions and properties with an associated importance. In order to make the final analysis as easy as possible, we express all the factors in a scale from 1 to 5. Five points are given for “most important” or “worst”, or generally for something having higher risk, which we want to test more, 1 points is given to less important areas.
3.1. Determining damage: What is important?
You need to know the possible damage resulting from an area to be tested. This means analyzing the most important areas of the product. In every product, there may be other factors playing a role, but the factors given here have been valuable in several projects.
Important areas can either be functions or functional groups, or properties such as performance, capacity, security etc. The result of this analysis is a list of functions and properties or combination of both that need attention. I am concentrating here on sorting functions into more or less important areas. The approach, however, is flexible and can accommodate other items.
You have to analyze the use of the software within its overall environment. Analyze the ways the software may fail. Find the possible consequences of such failure modes, or at least the worst ones. Take into account redundancy, backup facilities and possible manual check of software output by users, operators or analysts. Software that is directly coupled to a process it controls is more critical than software whose output is manually reviewed before use. If software controls a process, this process itself should be analyzed. The inertia and stability of the process itself may make certain failures less interesting.
Potential damage may be classified into the classes mentioned below, or quantified into money value, whichever seems better. In systems with large variation of damage it is better to use damage as absolute money value, and not classify it into groups.
A failure would be catastrophic (3)
Such failures may deal with large financial losses or even damage to human life. An example would be the gross uncoupling of all subscribers to the telephone network on a special date.
Failures leading to loosing the license, i.e. authorities closing down the business, are part of this class. Serious legal consequences may also belong here.
The last kind of catastrophic failures is endangering the life of people.
A failure would be damaging (2)
The program may not stop, but data may be lost or corrupted, or functionality may be lost until the program or computer is restarted.
A failure would be hindering (1)
The user is forced to workarounds, to more difficult actions to reach the same results.
A failure would be annoying (0)
This issue would be a problem that doesn’t affect functionality, but rather it makes the product less appealing to the user or customer. The significant risk is while the customer can live with the problem there is possible loss of faith by customers, which would mean longer-term loss of business because customers may avoid future purchase of products from the company.
Damage can also depend on how often a function or feature is used. Some functions may be used every day, other functions only a few times. Some functions may be used by many, some by few users. Give priority to the functions used often and heavily. The number of transactions per day may be an idea helping in finding priorities.
Sometimes this analysis is not quite obvious. In process control systems, for example, certain functionality may be invisible from the outside. In modern object oriented systems, there may be a lot of central libraries used everywhere. It may be helpful to analyze the design of the complete system.
Following is a hierarchy of functionality by user interaction:
Unavoidable (3)
An area of the product that most users will come in contact with during an average usage session (e.g. startups, printing, saving).
Frequent (2)
An area of the product that most users will come in contact with eventually, but maybe not during every usage session.
Occasional (1)
An area of the product that an average user may never visit, but that deals with functions a more serious or experienced user will need occasionally.
Rare (0)
An area of the product which most users never will visit, which is visited only if users do very uncommon steps of action. Critical failures, however, are still of interest.
Importance can be classified by using a scale from one to five. However, in some cases this does not sufficiently map the variation of the scale in reality. Then, it is better to use real values, like the cost of damage and the actual usage frequency.
 3.2. Failure probability: What is (presumably) worst?
The worst areas are the ones having most defects. The task is to predict where most defects are located. This is done by analyzing probable defect generators. In this section, some of the most important defect generators and symptoms for defect prone areas are presented. There exist many more, and you have to always include local factors in addition to the ones mentioned here.
- Complex areas
Complexity is maybe the most important defect generator. More than 200 different complexity measures exist, and research into the relation of complexity and defect frequency has been done for more than 20 years.
- Changed areas
Change is an important defect generator. One reason is that changes are subjectively understood as easy, and thus not analyzed thoroughly for their impact. Another reason is that changes are done under time pressure and analysis is not completely done.
- Impact of new technology, solutions, methods
Programmers using new tools, methods and technology experience a learning curve. In the beginning, they may generate many more faults than later. A good example is the first project with a new type of user interface. The general functionality may work well, but the user interface subsystem may be full of trouble.
- Impact of methods
Another factor to consider is the maturity of methods and models. Maturity means the strength of the theoretical basis or the empirical evidence. If software uses established methods, like finite state machines, grammars, relational data models, and the problem to be solved may be expressed suitably by such models, the software can be expected to be quite reliable. On the other hand, if methods or models of a new and unproven kind, or near the state of the art are used, the software may be more unreliable.
Most software cost models include factors accommodating the experience of programmers with the methods, tools and technology. This is as important in test planning, as it is in cost estimation.
- Impact of the number of people involved
The idea here is the thousand monkeys’ syndrome. The more people are involved in a task, the larger is the overhead for communication and the chance that things go wrong. A small group of highly skilled staff is much more productive than a large group of average qualification. In the COCOMO software cost model, this is the largest factor after software size. Much of its impact can be explained from effort going into detecting and fixing defects.
Areas where relatively many and less qualified people have been employed, may be pointed out for better testing.
Care should be taken in that analysis: Some companies employ their best people in more complex areas, and less qualified people in easy areas. Then, defect density may not reflect the number of people or their qualification.
- Impact of turnover
If people quit the job, new people have to learn the design constraints before they are able to continue that job. As not everything may be documented, some constraints may be hidden for the new person, and defects result. Overlap between people may also be less than desirable. In general, areas with turnover will experience more defects than areas where the same group of people has done the whole job.
- Impact of time pressure
Time pressure leads to people making short-cuts. People concentrate on getting the job done, and they often try to skip quality control activities, thinking optimistically that everything will go fine. Only in mature organizations does this optimism seems to be controlled.
Time pressure may also lead to overtime work. It is well known, however, that people loose concentration after prolonged periods of work. This may lead to more defects. Together with short-cuts in applying reviews and inspections, this may lead to extreme levels of defects density.
- Areas with many defects before
Defect repair leads to changes which lead to new defects, and defect prone areas tend to persist. Experience exists that defect prone areas in a delivered system can be traced back to defect prone areas in reviews and unit and subsystem testing. Evidence in studies and shows that modules that had faults in the past are likely to have faults in the future. If defect statistics from design and code reviews, and unit and subsystem testing exist, then priorities can be chosen for later test phases.
- Communication issues
If people working together on a project are not co-located, communication will be worse. This is true even on a local level.
In principle, geographical distribution is not dangerous. The danger arises if people with a large distance have to communicate, for example, if they work with a common part of the system. You have to look for areas where the software structure implies the need for good communication between people, but where these people have geography against them.
- One factor to be considered in general
This article is about high level testing. Developers test before this. It is reasonable to have a look at how developers have tested the software before, and what kind of problems they typically overlook. Analyze the unit test quality. This may lead to a further tailoring of the test case selection methods.
Looking at these factors will determine the fault density of the areas to be tested. However, using only this will normally over-value some areas. Typically, larger components will be tested too much. Thus, a correction factor should be applied: Functional size of the area to be tested. I.e. the total weight of this area will be “fault proneness / functional volume”. This factor can be found from function point analysis early, or from counting code lines if that is available.
What to do if you do not know anything about the project, if all the defect generators can not be applied?
You have to run a test. A first rough test should find defect prone areas, the next test will then concentrate on them. The first test should cover the whole system, but be very shallow. It should only cover typical business scenarios and a few important failure situations, but cover all of the system. You can then find where there was most trouble, and give priority to these areas in the next round of testing. The next round will then do deep and through testing of prioritized areas.
3.3. How to calculate priority of test areas
The general method is to assign weights, and to calculate a weighted sum for every area of the system. Test where the result is highest!
For every factor chosen, assign a relative weight. You can do this in very elaborate ways, but this will take a lot of time. Most often, three weights are good enough. Values may be 1, 3, and 10. (1 for “factor is not very important”, 3 for “factor has normal influence”, 10 for “factor that has very strong influence”).
For every factor chosen, you assign a number of points to every product requirement (every function, functional area, or quality characteristic. The more important the requirement is, or the more alarming a defect generator seems to be for the area, the more points. A scale from 1 to 3 or 5 is normally good enough. Assigning the points is done intuitively.
The number of points for a factor is then multiplied by its weight. This gives a weighted number of points between 1 and 50. These weighted numbers are then summed up for damage (impact) and for probability of errors, and finally multiplied. As many intuitive mappings from reality for points seem to involve a logarithmic scale, where points follow about a multiplier of 10, the associated risk calculation should ADD the calculated weighted sums for probability and damage. If most factors’ points inherently follow a linear scale, the risk calculation should MULTIPLY the probability and damage points. The user of this method should check how they use the method! Testing can then be planned by assigning most tests to the areas with the highest number of points.
 Figure 2: Failure Probability
In Figure 2, the table suggests that function «invoicing» is most important to test, «order registration» and performance of order registration. The factor which has been chosen as the most important is visibility.
A word of caution: The assignment of points is intuitive and may be wrong. Thus, the number of points can only be a rough guideline. It should be good enough to distinguish the high-risk areas from the medium and low risk areas. That is its main task. This also means you don’t need to be more precise than needed for just this purpose. If more precise test prioritization is necessary, a more quantified approach should be used wherever possible.
4. Making testing more effective
More effective test means to find more and more important defects in the same amount of time.
The strategy to achieve this is to learn from experience and adapt testing.
First, the whole test should be broken into four phases:
- test preparation
- pre-test
- main test
- after-test.
Test preparation sets up areas to test, the test cases, test programs, databases and the whole test environment.
Especially setting up the test environment can give a lot of trouble and delay. It is generally easy to install the program itself and the correct operating system and database system. Problems often occur with the middleware, i.e. the connection between software running on a client, and software running on different servers. Care should be taken to thoroughly specify all aspects of the test environment, and dry runs should be held, in order to ensure that the test can be run when it is time to do it.
The pre-test is run after the software under test is installed in the test lab. This test contains just a few test cases running typical day to day usage scenarios. The goal is to test if the software is ready for testing at all, or totally unreliable or incompletely installed. Another goal may be to find some initial quality data, i.e. find some defect prone areas to focus the further test on.
The main test consists of all the pre-planned test cases. They are run, failures are recorded, defects found and repaired, and new installations of the software made in the test lab. Every new installation may include a new pre-test. The main test takes most of the time during a test execution project.
The after-test starts with every new release of the software. This is the phase where optimization should occur. Part of the after-test is regression testing, in order to find possible side-effects of defect repair. But the main part is a shift of focus.
The type of defects may be analyzed. In principle, every defect is a symptom of a weakness of some designer, and it should be used to actively search for more defects of the same kind.
5. Strategies for prevention
The starting scenario for this article was the situation where everything is late and where no professional budgeting has been done. In most organization, there exist no experience data and there exists no serious attempt to really estimate costs for development, testing, and error cost in maintenance. Without experience data there is no way to argue about the costs of reducing a test.
The imperatives are:
- You need a cost accounting scheme
- You need to apply cost estimation based on experience and models
You need to know how test quality and maintenance trouble interact
Measure:
- Size of project in lines of code, function points etc.
- Percentage of work used in management, development, reviews, test preparation, test execution, and rework
- Amount of rework during first three or six months after release
- Fault distribution, especially causes of user detected problems.
- Argue for testing resources by weighting possible reductions in rework before and after delivery against added testing cost.
Summary
Testing in a situation where management cuts both budget and time is a bad game. You have to endure and survive this game and turn it into a success. The general methodology for this situation is not to test everything a little, but to concentrate on high risk areas and the worst areas.
Priority 1: Return the product as fast as possible to the developers with a list of as serious deficiencies as possible.
Priority 2: Make sure that, whenever you stop testing, you have done the best testing in the time available!
(This is a shortened version of the article originally published on http://www.methodsandtools.com/archive/archive.php?id=31)